
 Full Screen
Anomalies
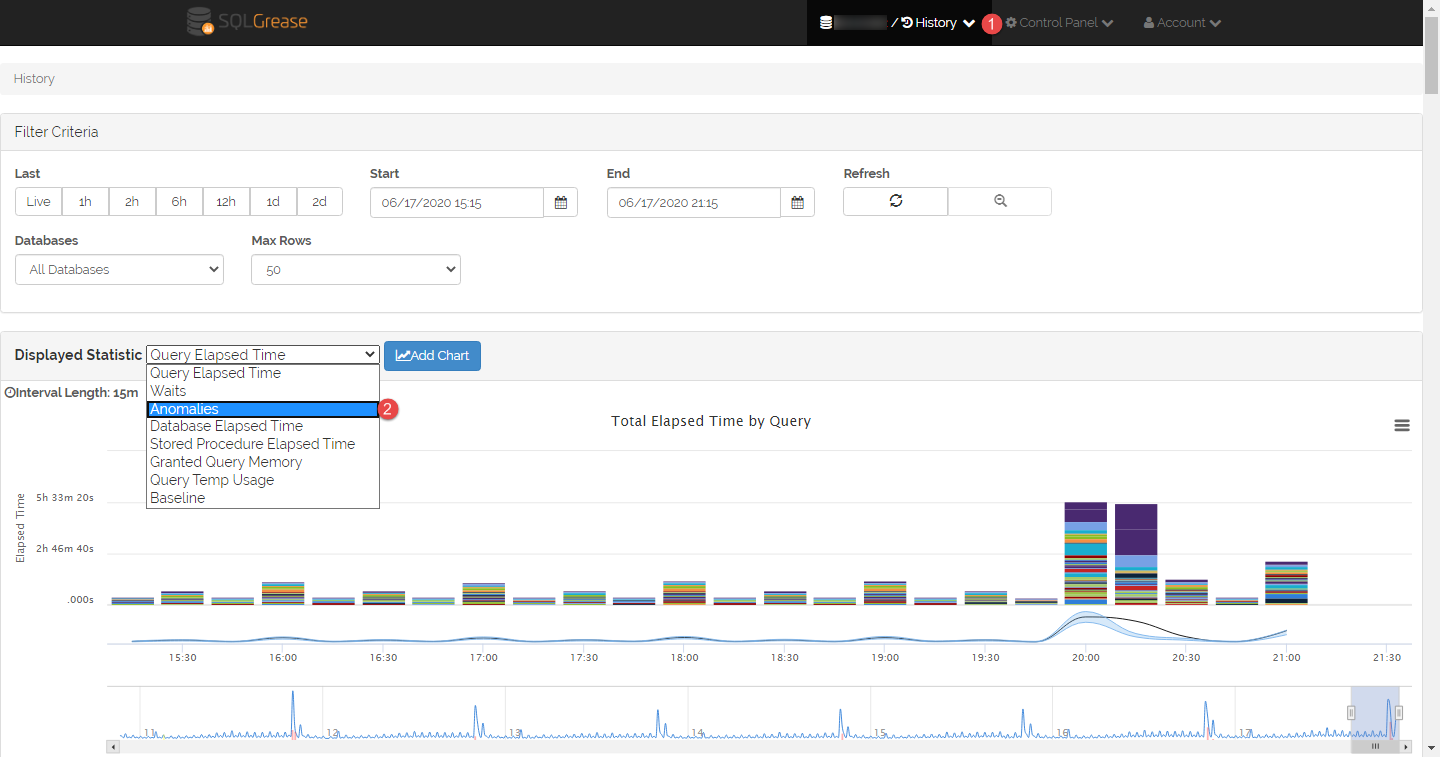
We previously introduced machine learning to identify performance anomalies for total workload on a monitored SQL Server instance. We are now using machine learning to find the specific queries that caused the anomalous workload. This feature can be found in the history view 1 under the "Anomalies" 2 statistics.
 Full Screen
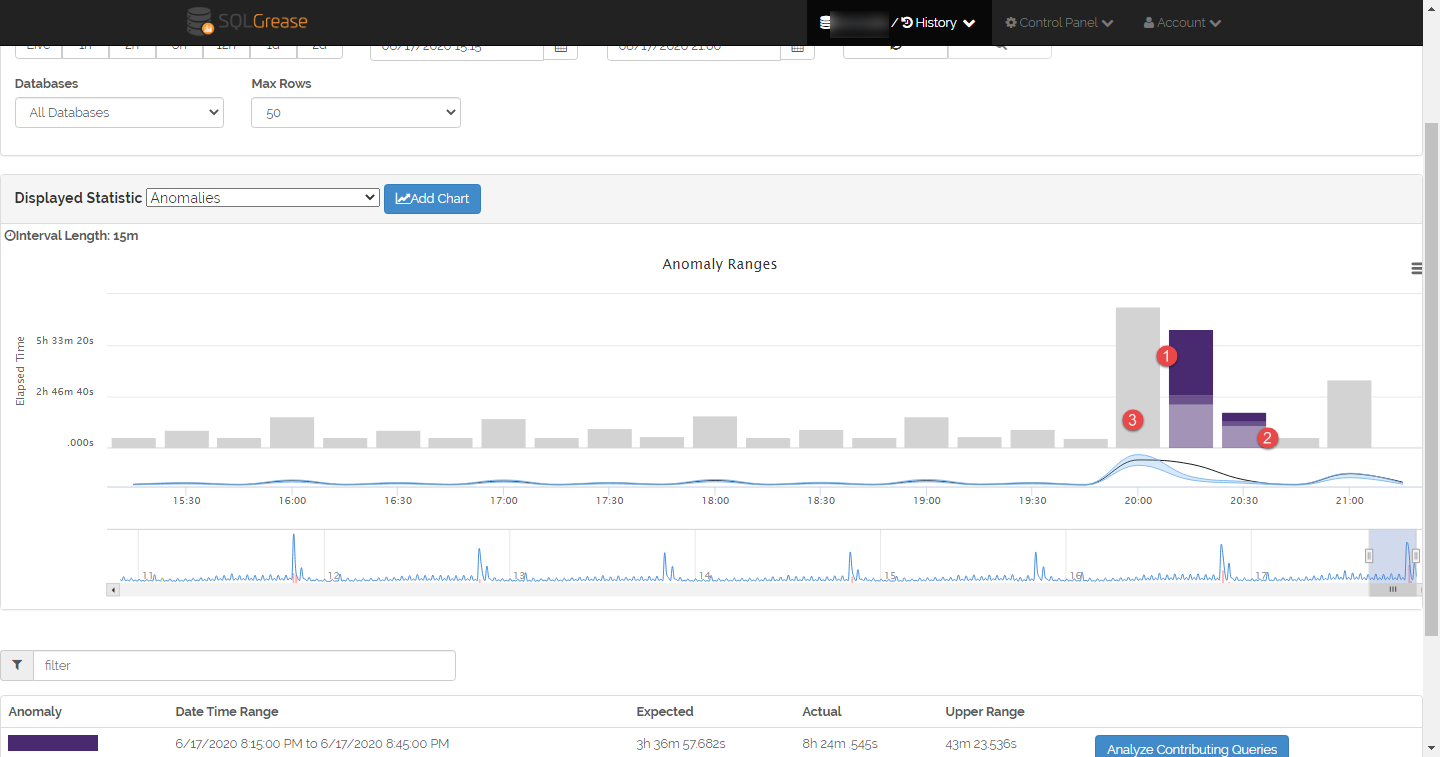
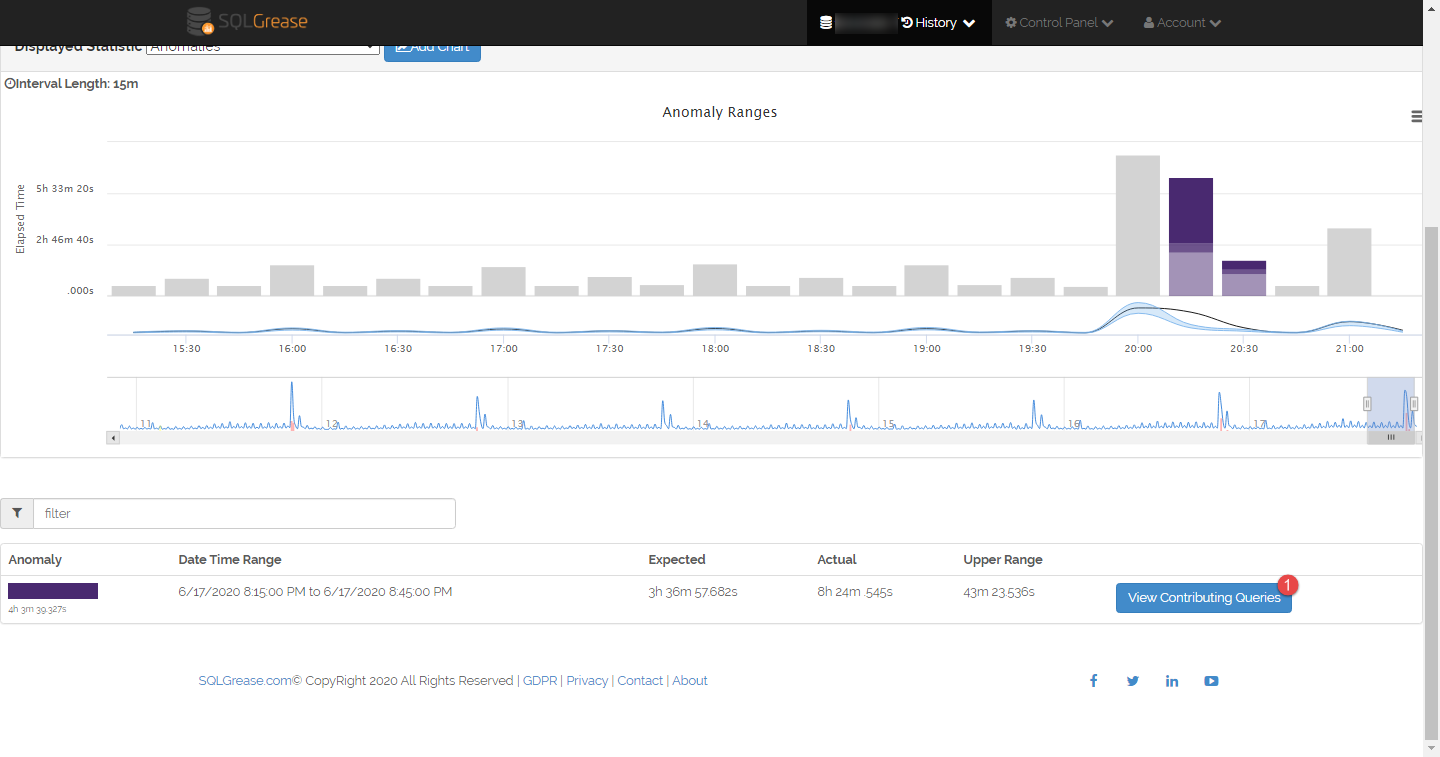
The Anomalies statistic shows ranges of time that performance anomalies occurred. Each range in time of anomalous performance is displayed as a separate series. The start 1 and end 2 of an anomaly range is determined by when a performance anomaly is first detected (within a 15 minute interval) and when it no longer exists. The rationale for grouping performance anomalies into ranges is they normally don't occur back to back within a 15 minute interval. This approach makes it easier to work through root cause analysis for one specific performance problem. This approach will also make itself more clear in our next update where SQLGrease will perform root cause analysis (RCA) for a specific anomaly range. The non-anomaly ranges of time are displayed grayed out 3.
 Full Screen
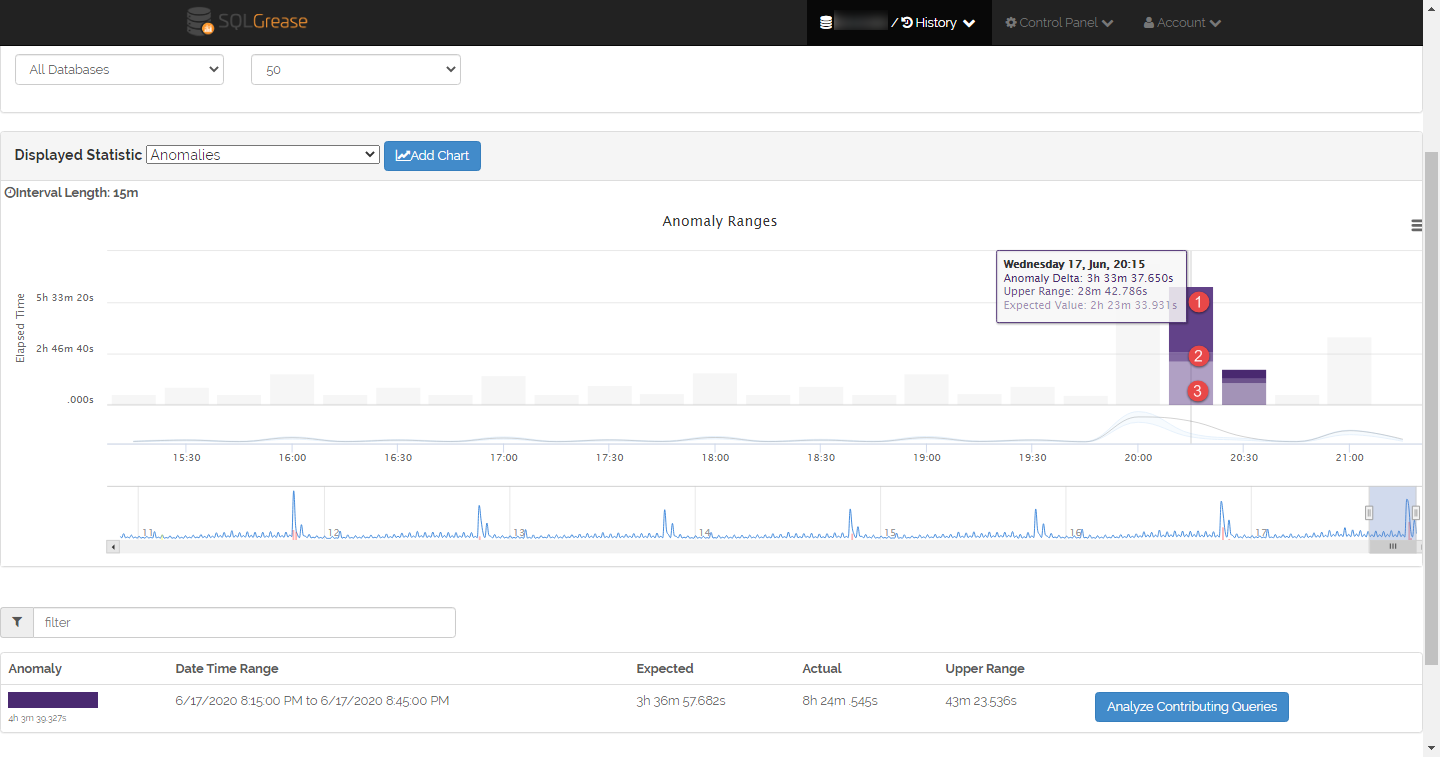
There are three components to the anomaly range. The Expected Value, the Upper Range, and the Anomaly Delta.
The Anomaly Delta 1 is a measure of how far the query performed outside the normal operating range. The normal operating range would be the Expected Value + Upper Range.
The Upper Range 2 is a margin for where this query should perform in. If the total elapsed time of the query is in excess of the upper range, this will be considered an anomaly.
The Expected Value 3 is what the machine learning algorithm predicted. This is the expected total elapsed time of all executions of the query in this 15 minute interval. This value is based upon a daily workload pattern for the first three weeks or monitoring. If a weekly pattern is detected after the first three weeks, this value will be based upon the weekly pattern.
 Full Screen
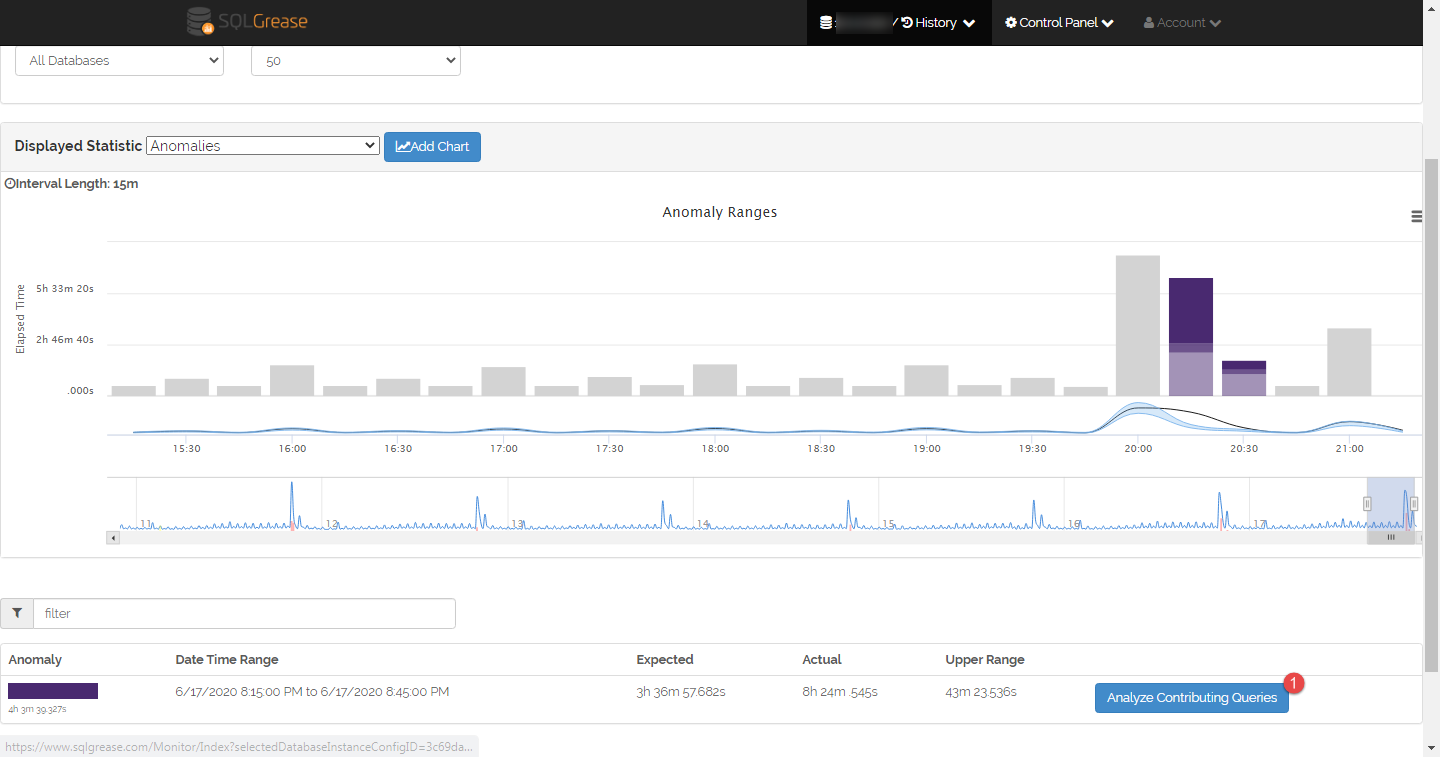
A summary of each anomaly range is displayed at the bottom of the screen. Along with this is the Analyze Contributing Queries button 1. Clicking this button will initiate a request to analyze which queries contributed to this anomaly range.
 Full Screen
Once analysis is complete, the View Contributing Queries 1 button will appear. Clicking on this will filter activity to queries that were detected to be anomalous.
 Full Screen
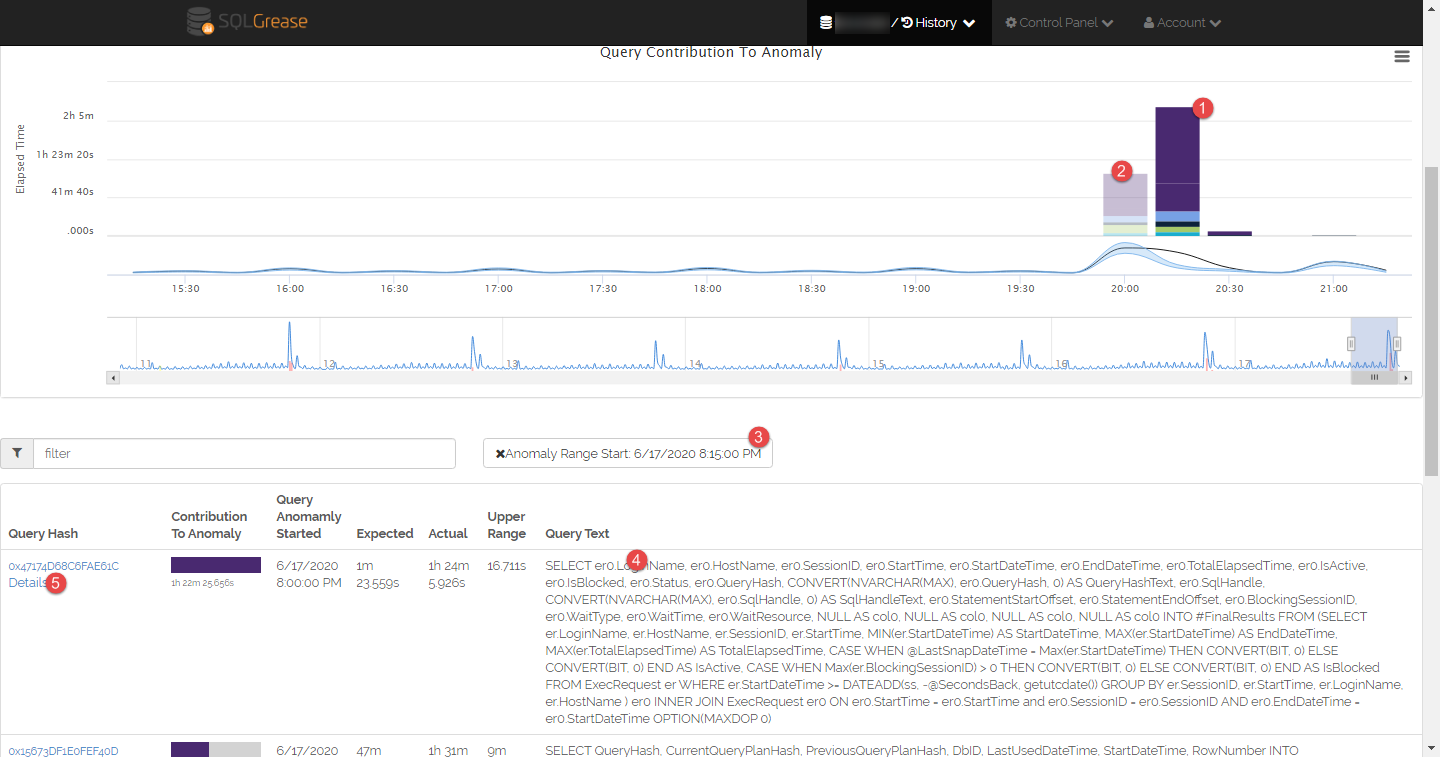
Each series displayed is a different queries contribution to the anomaly detected 1. Since the query could have started behaving in an anomalous manner prior to the total workload anomaly occurring, the individual query anomaly is displayed as well. It should be noted this is displayed with transluscency to help indicate this 2. The anomalous query text is displayed along with summary statistics for the query anomaly 4. The Details link 5 can be clicked to view the query details in order to help diagnose the root cause.
After clicking the View Contributing Queries button, a filter will appear for the anomaly range 3. Removing this filter (by clicking the X) will return to the anomaly range view.
 Full Screen
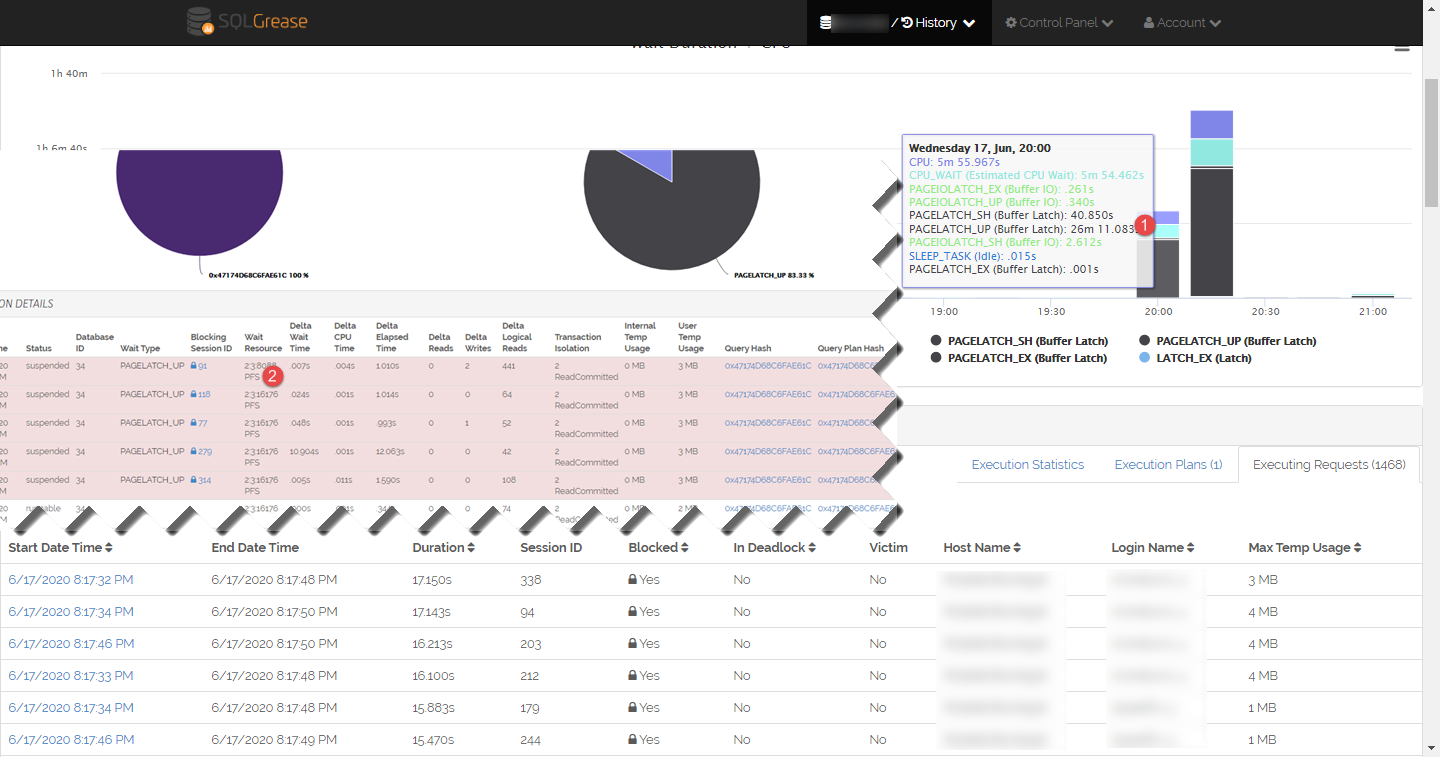
In this example the Query Details reveals the query was spending a majority of its time in PAGELATCH waits 1. A closer inspection of the executing requests reveals the query was waiting on a PFS page 2.