
NEW RELIC PLUGIN - Query Workload Dashboard
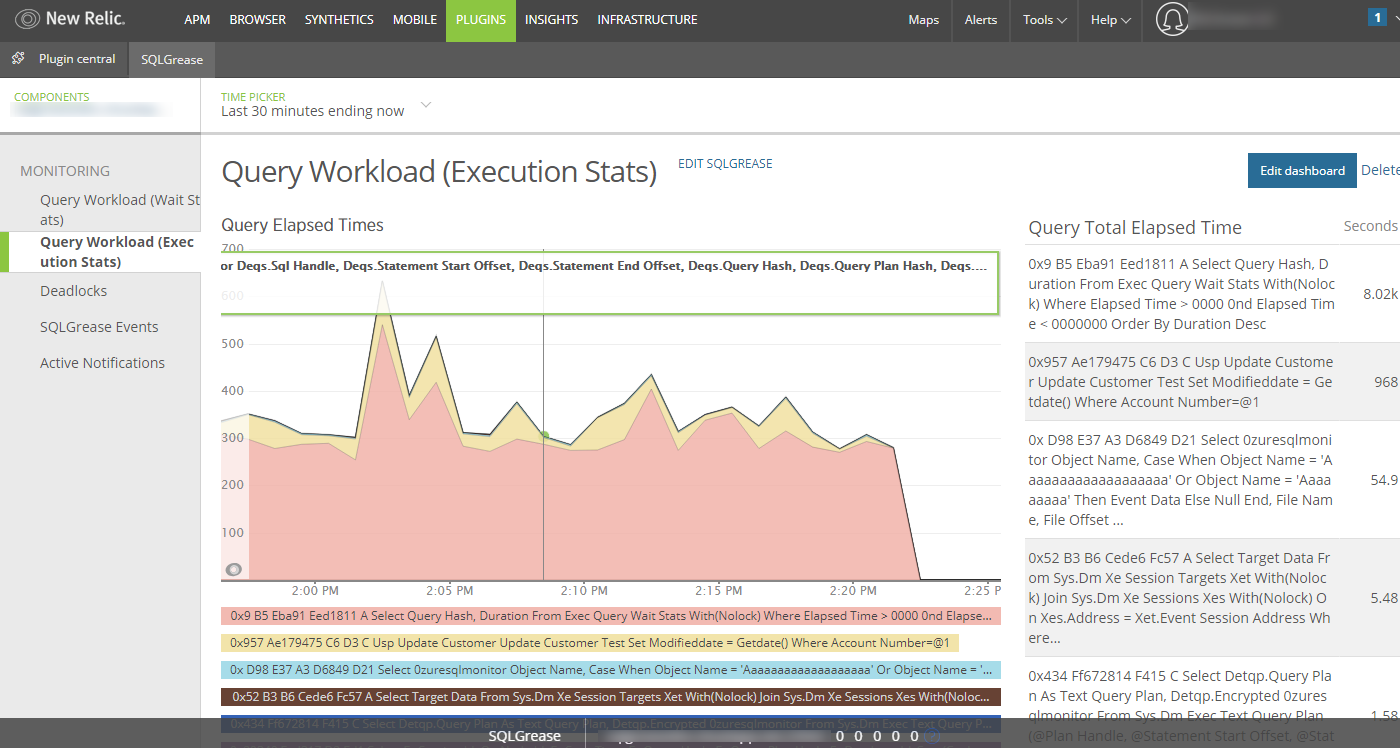
The Query Workload (Execution Stats) dashboard displays general query execution statistics.
- Home
- New Relic Plugin
- Query Workload (Elapsed Time) Dashboard
Overview
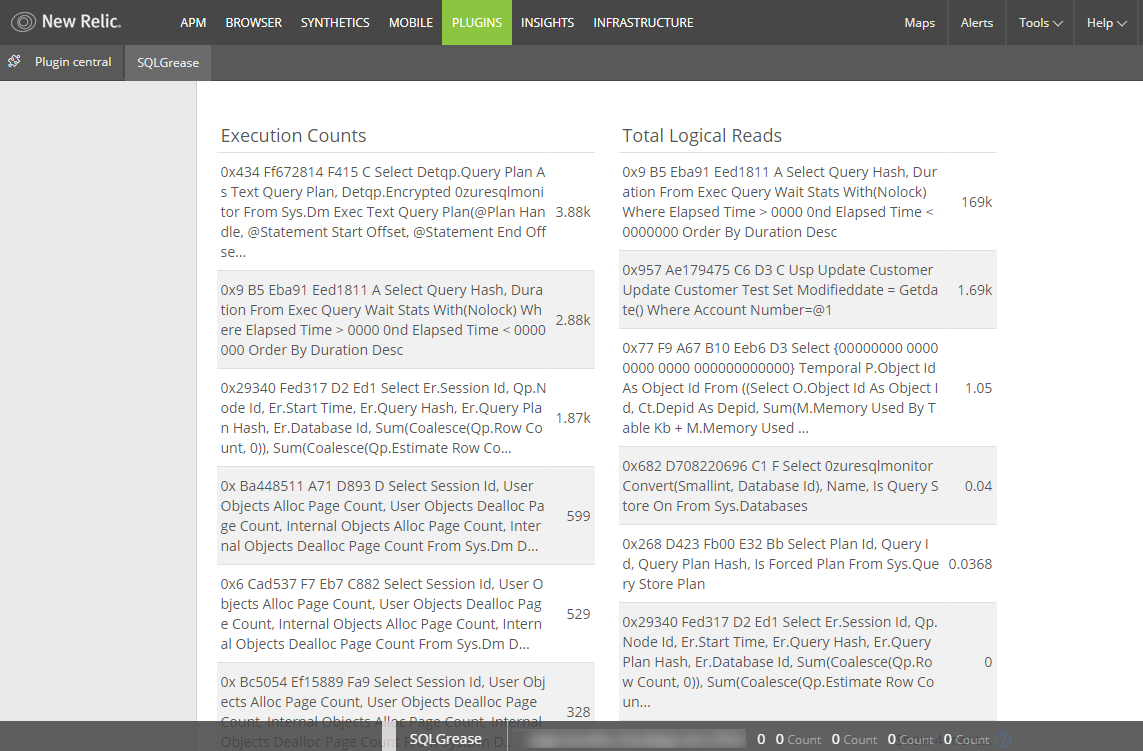
SQLGrease collects query execution statistics such as execution counts, elapsed times, logical reads, physical reads, and row counts.
The plugin exposes this information via the Query Workload (Elapsed Time) dashboard. At the top of the elapsed time stats dashboard is a chart displaying the top query executions by elapsed time. These statistics are at an aggregate level for all executions of the query within the displayed timeframe. More granular statistics are available in the SQLGrease UI.
Query Execution Stats
The execution counts, elapsed times, logical reads, physical reads, and row counts are displayed in tabular form for the top 10 queries in the monitored interval.
Query Text
The query text displayed has several components to it.
- Query Hash
- Stored Procedure Name
- Query Text
Query Hash
The Query Hash is an identifier for queries used in SQL Server. SQLGrease keys all of its query performance metrics on query hashes. You can use this value to locate queries found from the dashboard in SQLGrease. Additionally, since this is also recognized by SQL Server, you can directly interrogate SQL Server DMV's with this value.
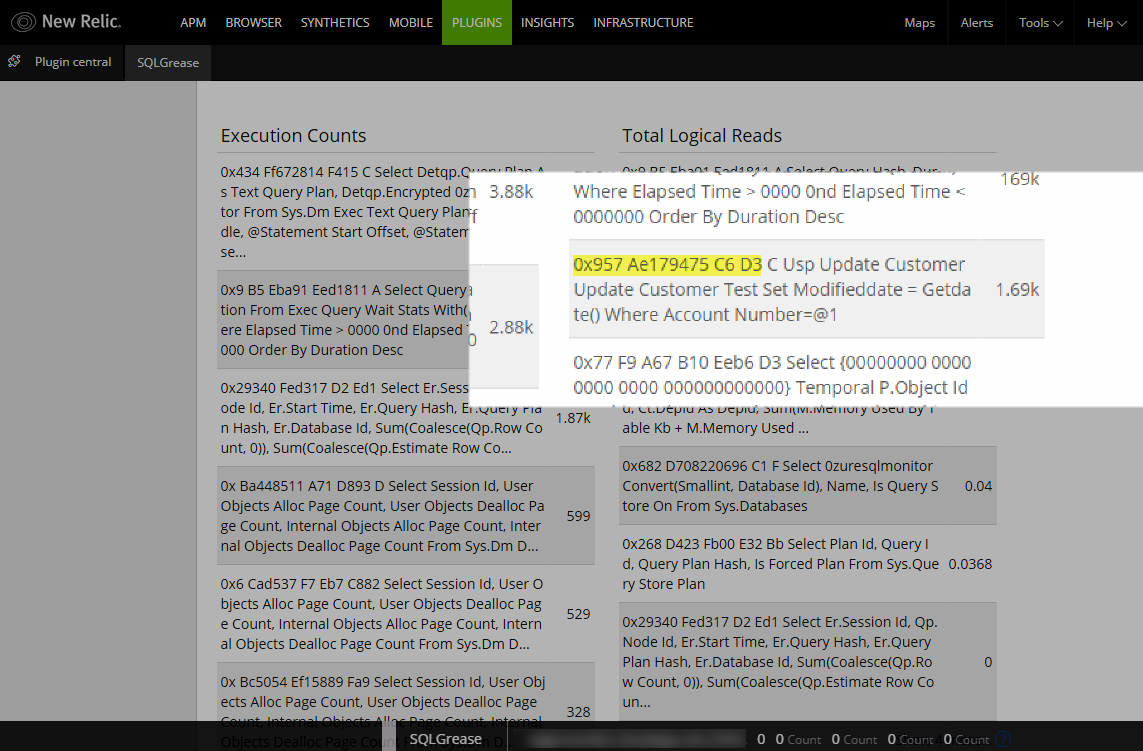
Stored Procedure
If the query is related to a stored procedure, the stored procedure name will be displayed.
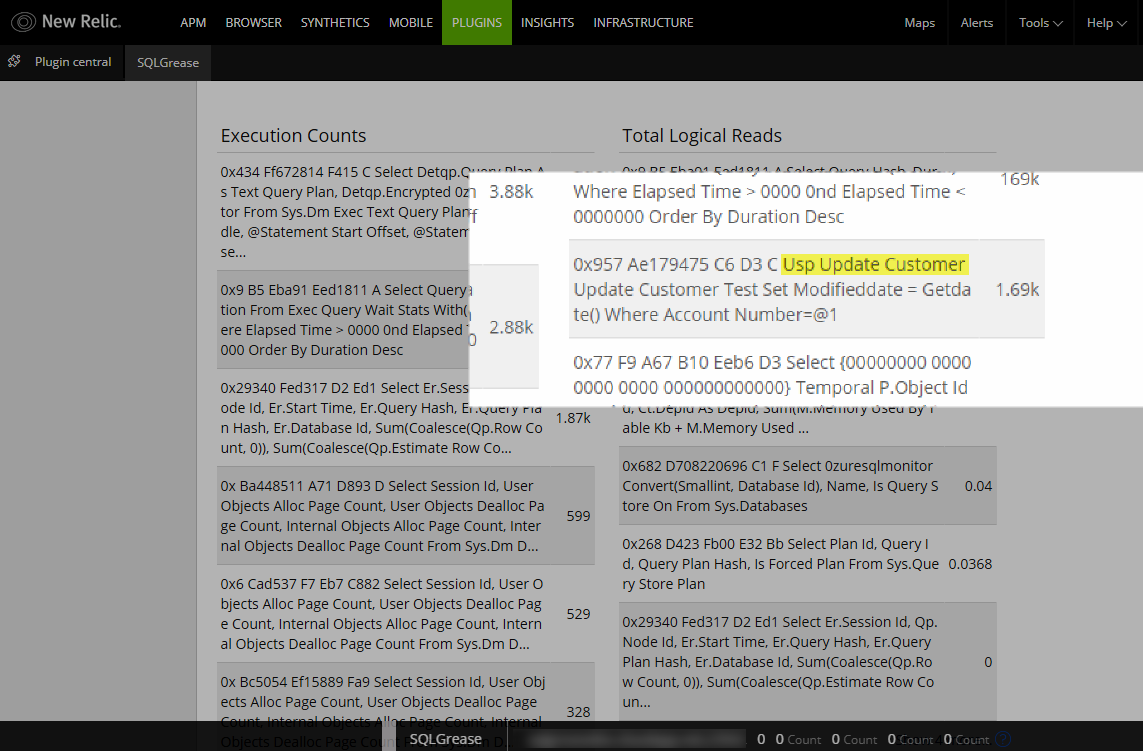
Query Text
The query is the last part of the name.
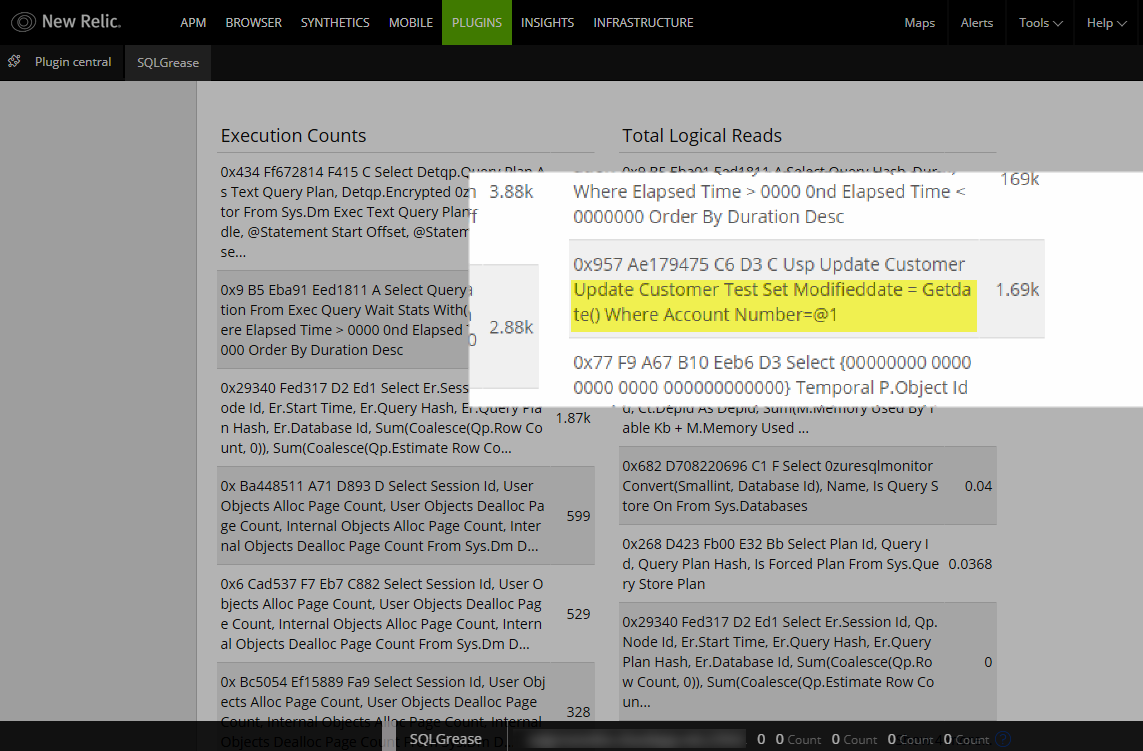
Query Text Limitations
The query text may be truncated based on a 250 character limit. If the query is truncated it will display elipsis where it was truncated. Additionally, certain characters will be stripped due to New Relic limitations on metric naming. The following characters will be removed if they are part of a query:
- [
- ]
- /
- |
- *
Full query text is available in the SQLGrease UI.