
NEW RELIC PLUGIN - Query Workload (Wait Stats) Dashboard
The Query Workload (Wait Stats) dashboard displays a breakdown of where time is being spent in queries executed.
- Home
- New Relic Plugin
- Query Workload (Wait Stats) Dashboard
Overview
SQLGrease measures query performance using the concept of wait event analysis. Wait event analysis gives visibility into where a query is spending its time. An executing query is either using CPU or is waiting on something.
As of SQL Server 2017 there are over 900 wait types. While SQLGrease collects details on all 900+ wait types, the plugin groups these wait types into the following categories:
- CPU Time
- Lock Wait
- Log Wait (SQL Server transaction log)
- IO Wait
- Network Wait
- Buffer Wait
- Memory Wait
- Parallel Wait
- Other
By analyzing query performance with this approach, SQLGrease can provide details of where queries are spending time executing. SQLGrease does not collect this info from sys.dm_os_wait_stats. That approach, while simple, genereates a lot of information that is not impacting query performance. Instead SQLGrease collects wait stats at the executing query level - this provides actionable information to tune with.
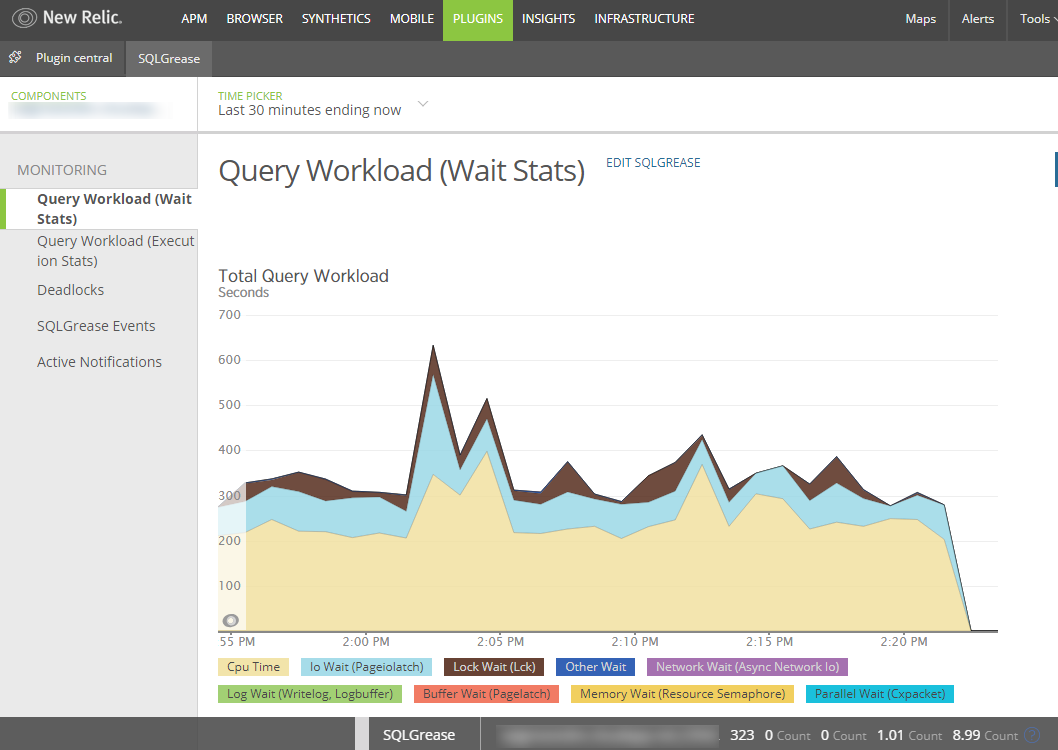
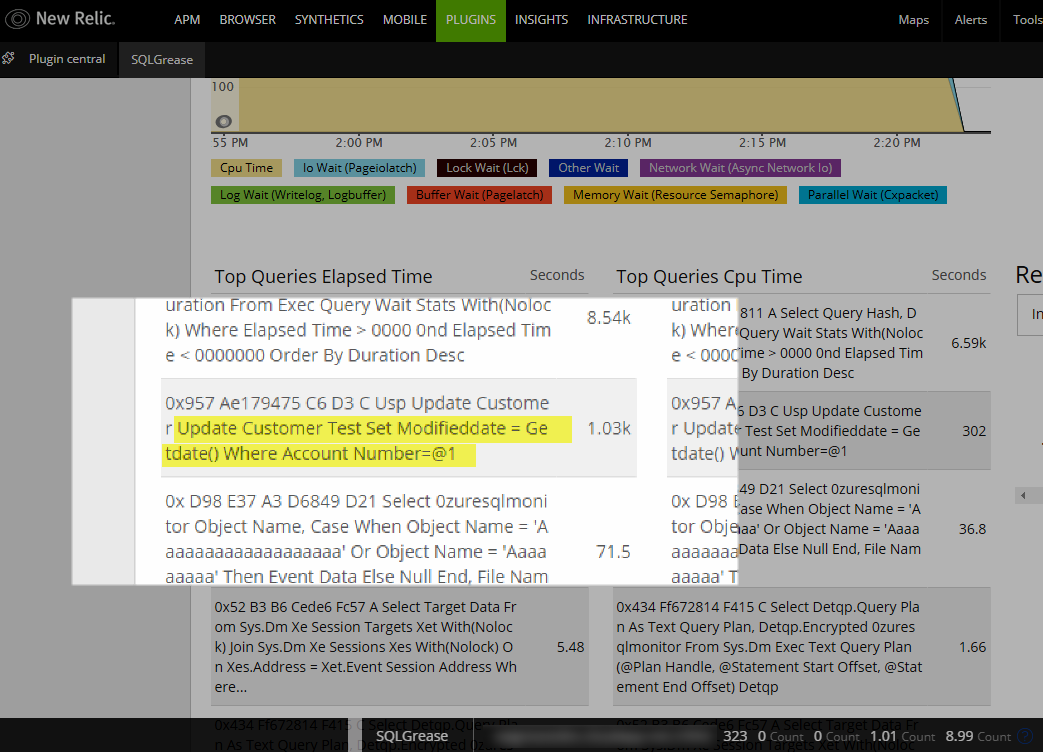
Query Workload (Wait Stats)
The plugin exposes this information via the Query Workload (Waits) dashboard. At the top of the dashboard is a chart (Total Query Workload) displaying a breakdown of CPU Time as well as waits. These statistics are at an aggregate level for all executions of the query within the displayed timeframe. More granular statistics are available in the SQLGrease UI.
Query Waits
Below the Total Query Workload chart is a breakdown of the top 10 queries in the monitored interval impacted by the waits displayed in the chart. These statistics are at an aggregate level for all executions of the query within the displayed timeframe. More granular statistics are available in the SQLGrease UI.
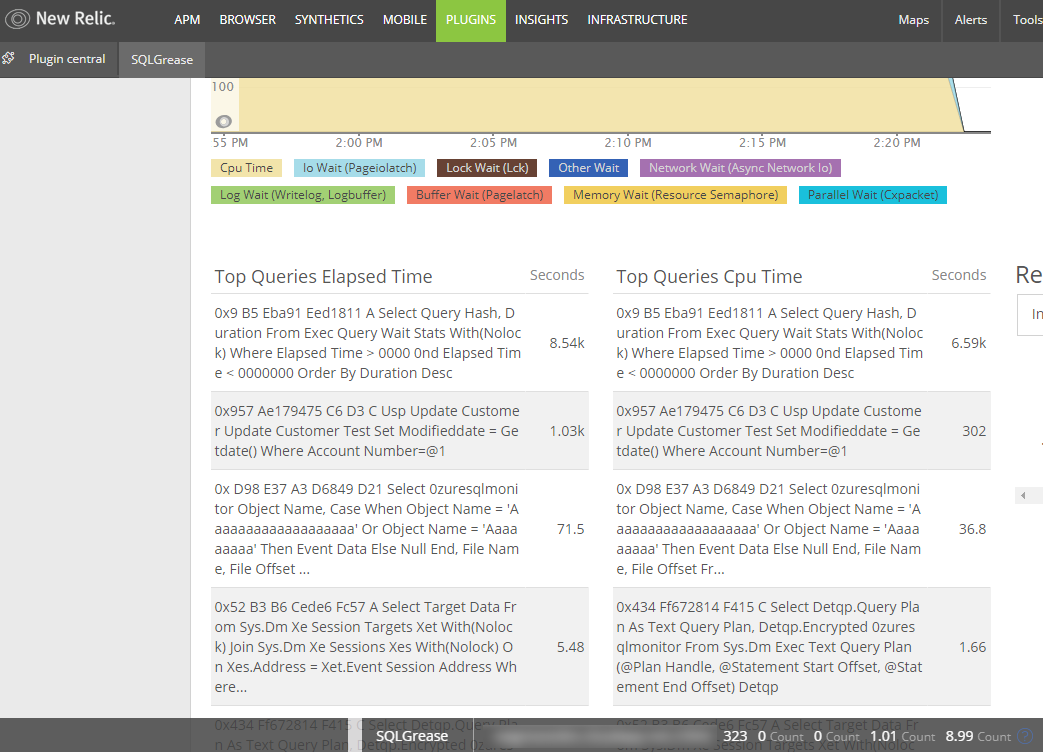
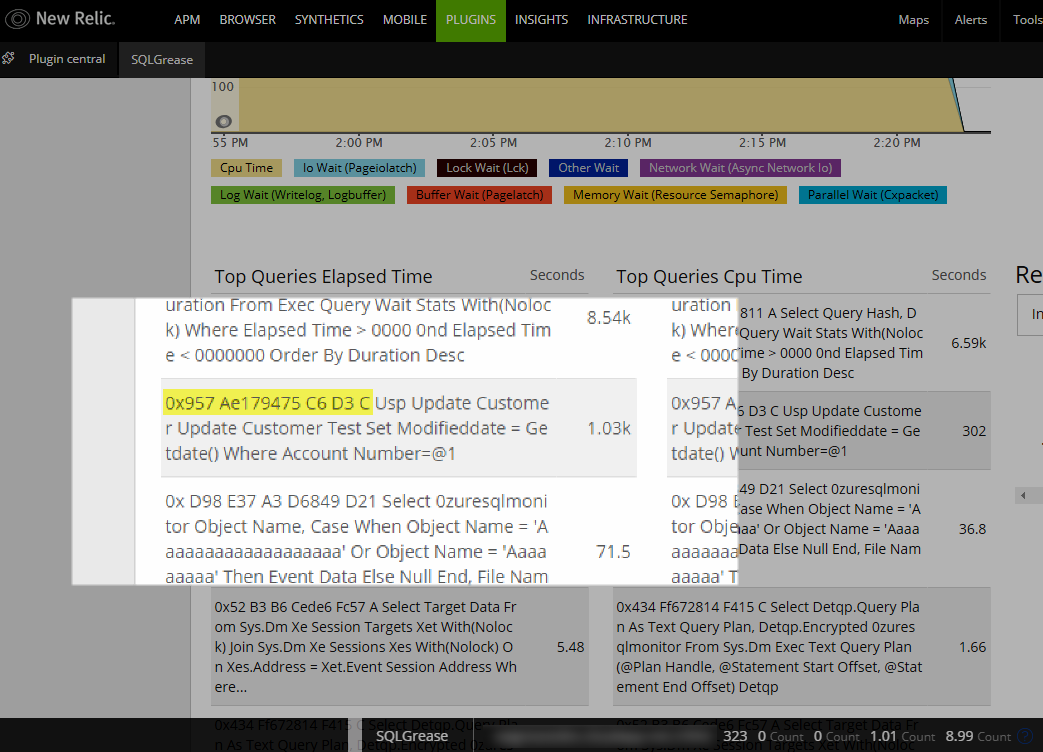
Query Text
The query text displayed has several components to it.
- Query Hash
- Stored Procedure Name
- Query Text
Query Hash
The Query Hash is an identifier for queries used in SQL Server. SQLGrease keys all of its query performance metrics on query hashes. You can use this value to locate queries found from the dashboard in SQLGrease. Additionally, since this is also recognized by SQL Server, you can directly interrogate SQL Server DMV's with this value.
Stored Procedure
If the query is related to a stored procedure, the stored procedure name will be displayed.
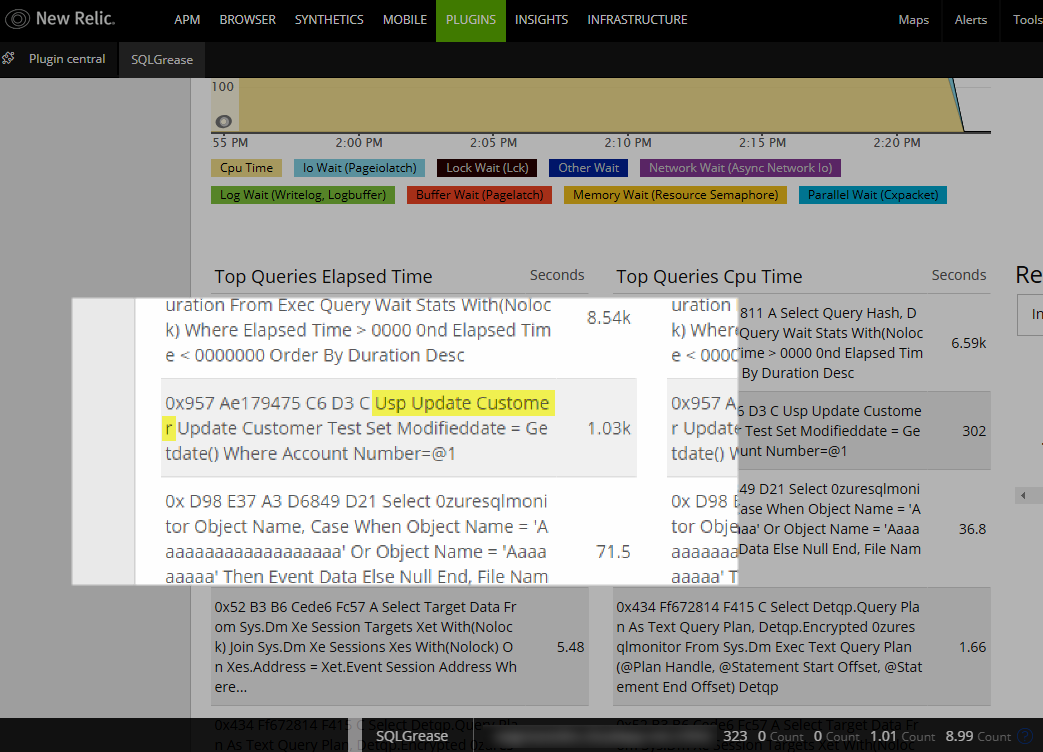
Query Text
The query is the last part of the name.
Query Text Limitations
The query text may be truncated based on a 250 character limit. If the query is truncated it will display elipsis where it was truncated. Additionally, certain characters will be stripped due to New Relic limitations on metric naming. The following characters will be removed if they are part of a query:
- [
- ]
- /
- |
- *
Full query text is available in the SQLGrease UI.